
Exercise: Puhti web interface#
Timing
Time: 30 min
Goals
Getting familiar with the Puhti web interface
First contact with the supercomputer
Files: moving, viewing, editing
Graphical tools: Visual Studio Code, QGIS, Jupyter, RStudio
See info about Puhti and your project
Prerequisites
CSC user account and project with access to Puhti.
Get familiar with Puhti web interface#
Open Puhti web interface and log in
Change the default project
project_2015299is an example project name, replace with your own CSC project name.
Info#
Puhti general status: bottom of front page
Sometimes when the
Disk laghere is high, reading and writing files might get slow.
Own projects, remaining billing units:
Tools->Project viewDisk usage of own projects:
Tools->Disk quotasRunning jobs:
Jobs->Active jobs
Files#
Open home directory:
Files->Home DirectoryCreate new
myfile.txtfile and add some text to it.Create new directory
mydataMove the new file under
mydata:Mark check-box in front of the file
Click
Copy/MoveOpen
mydataClick
Move
Open your
mydatafolderDownload your file to your local computer
Moving data
The web interface can be used for moving up to 10GB of data. If you have more data, use other tools. More info on moving data.
Graphical applications#
Desktop with QGIS#
QGIS, GRASS GIS, SAGA GIS, SNAP etc are available via Desktop
Open the Desktop launch page: from front page or
Apps -> DesktopUse settings:
(Reservation:
geocomputing_day1, only during course)Project:
project_2015299Partition: interactive (
smallduring course)Number of CPU cores: 1
Memory (Gb): 4
Local disk: 0
Time: 0:15:00
Launch
Wait a moment for Desktop to start ->
Launch DesktopDouble-click the QGIS icon
Open Statistic Finland Paavo post code data
Layer->Add layer->Add vector layerSource Type:
FileSource:
...->/appl/data/geo/tilastokeskus/paavo/2023/pno_tilasto_2023.shp
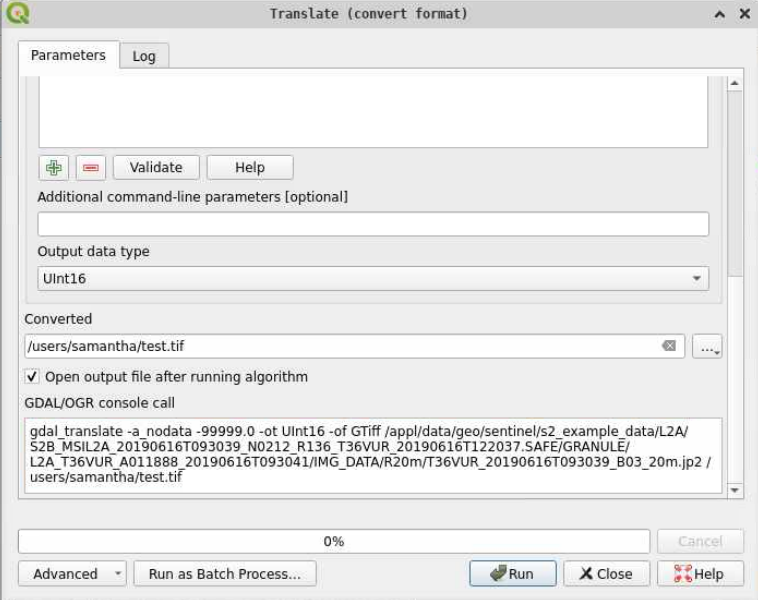
See file information with GDAL
Processing->Toolbox->GDAL->Vector miscellanious->Vector informationThe open dataset is selected by default
RunNote, if interested in moving from graphical QGIS to scripting:
The GDAL commandline command is displayed in the lower part of dialog box and log.
Advancedmenu provides this command also asqgis_processingcommand and as PyQGIS code.
End the session:
Close QGIS.
Close the web tab
Find the session in the Active sessions view and select
CancelThis only ends the Desktop session, any files written during the session would be available also afterwards.
QGIS in practice on supercomputer
QGIS is designed for desktop use and it mostly uses only 1 core, so running it on a supercomputer is rather slower than on desktop. QGIS is in Puhti and LUMI mainly for easy viewing of input and output data.
With
qgis_processingor PyQGIS scripts it is possible to parallelize your data analysis. In general other Python packages are faster, but if you have these scripts already available, they can be used.
Extra#
Look from CSC Docs how to start SNAP or some other tool of your interest in web interface.
Key points
Web interface provides easy access to Puhti and its graphical tools.
QGIS, SNAP, Jupyter, RStudio, Visual Studio Code are the most used tools.